See the flight, not the spreadsheet
October 7, 2026 | Product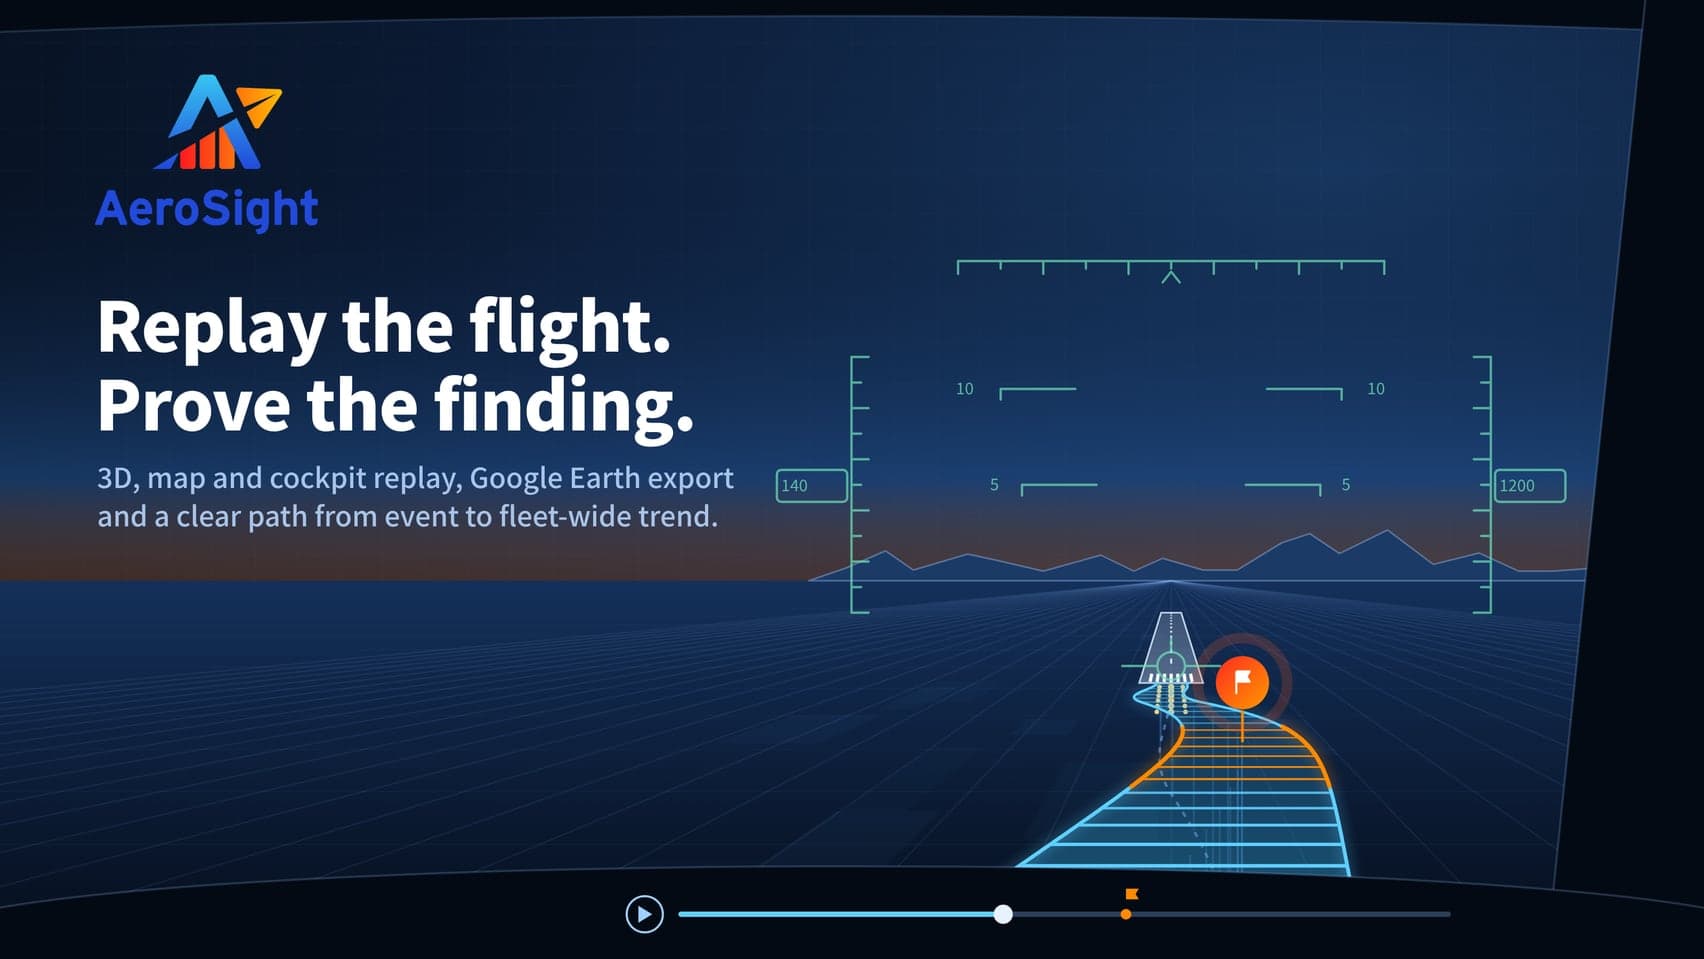
AeroSight Team
An event flag says a threshold was crossed, not what happened. AeroSight v2 starts from the flight: its weather and published procedure in view, three replay views and Google Earth export, and a path from detection and validated finding to a trend the Accountable Manager can act on.
An event flag tells you that a threshold was crossed. It does not tell you what happened. The distance between a row in a table and an understanding of the flight is where a Flight Data Analyst's week goes: pulling parameters, plotting them, checking the plot against the approach procedure, asking a pilot colleague what that would have looked like from the seat.
AeroSight v2 closes that distance. You still get the parameters, but you start from the flight, with the weather it was flown in and the procedure it was meant to follow already in view.
Replay the flight in three different ways
Every flight you upload can be replayed in 3D over terrain, on a 2D map, or from a cockpit view.
The 3D replay puts the aircraft, the terrain and the flight path where they belong. An unstable approach stops being a column of descending numbers and becomes a visible shape: the turn onto final, the height at the gate, where the configuration settled. The 2D map gives you the ground track against the runway and the procedure, which is what you want for a taxi event, a go-around, or a question about which runway was actually used. The cockpit view rebuilds the instrument picture from the recorded parameters, so you can read the approach the way it presented itself in the seat.
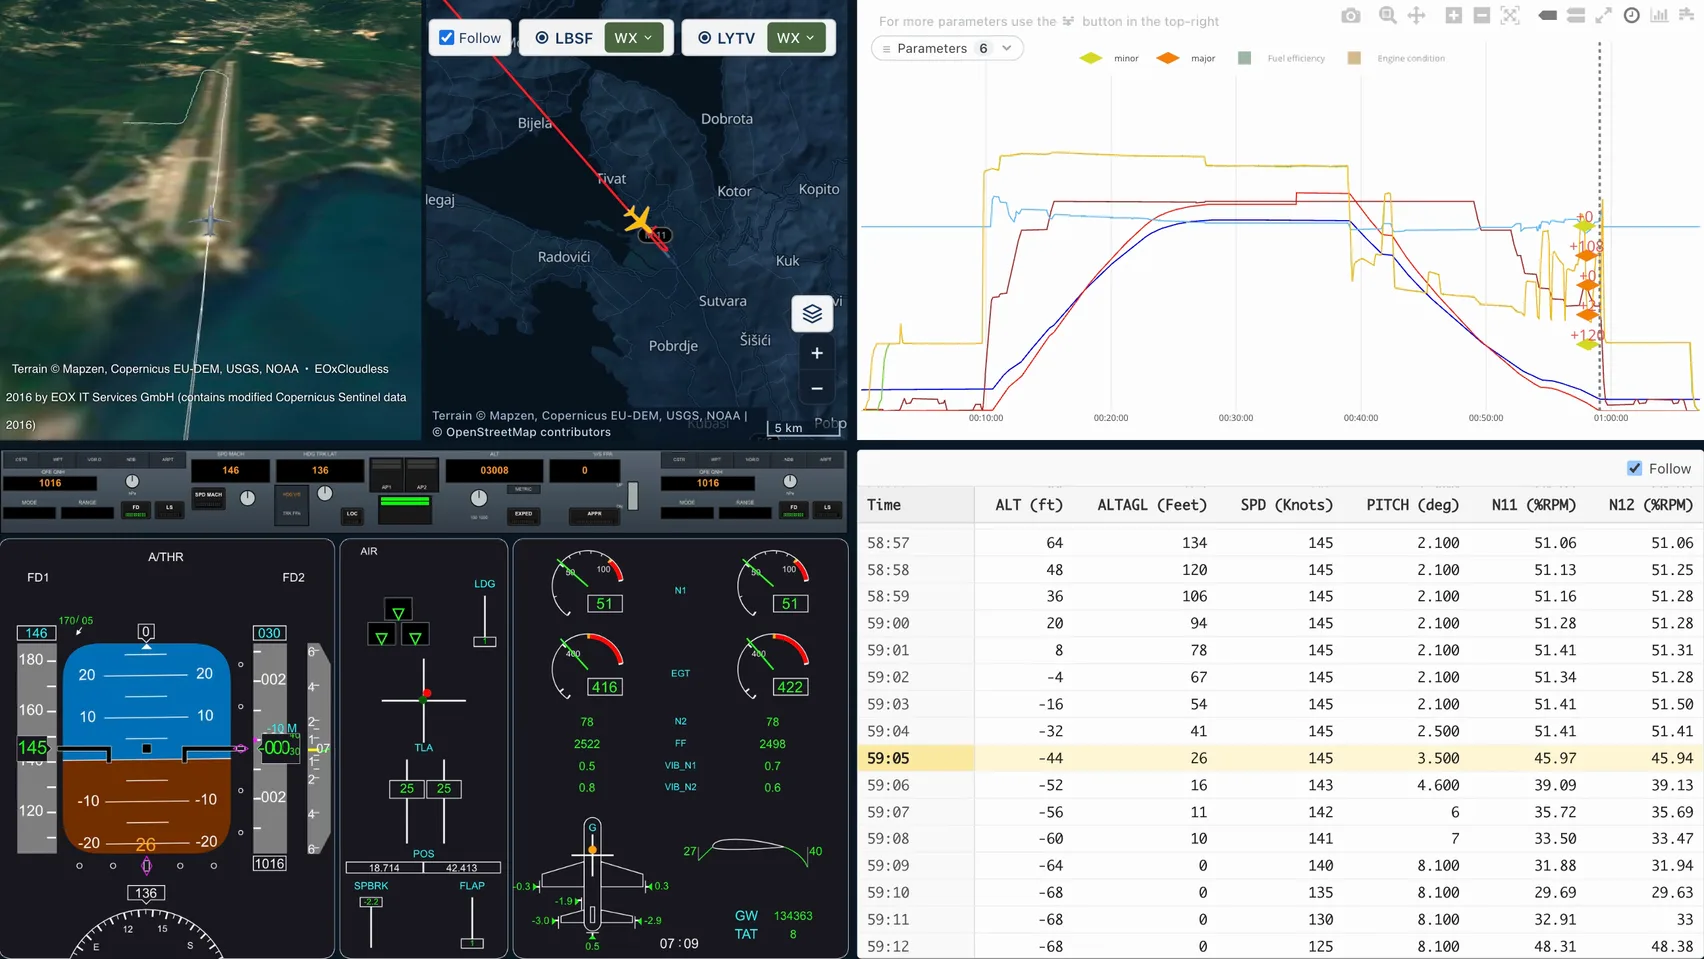
Imagery: EOxCloudless 2016 by EOX IT Services GmbH (contains modified Copernicus Sentinel data 2016), CC BY 4.0. Map data © OpenStreetMap contributors. Terrain: Mapzen terrain tiles. Produced using Copernicus data and information funded by the European Union — EU-DEM layers. SRTM and GMTED2010 data courtesy of the U.S. Geological Survey. ETOPO1: NOAA National Centers for Environmental Information.
And when the person who needs to see it does not have a login, whether that is a chief pilot, an instructor captain or an investigator, you can export the flight to Google Earth and send it. They open it in a tool they already have, and the flight data can be easily analyzed.
The weather and the navigational procedures, in the picture
In version 2 the weather and the published navigational procedures are connected throughout, from the live view of your fleet to each event. Every flight carries its weather: the METAR around departure and arrival sits on the flight's overview, decoded into wind speed and wind direction, visibility, temperature and pressure with the raw report beside it, and the same conditions travel with each event, so validation starts with the weather already in front of you.
On the map, the procedure is there to compare against. Choose the SID, the STAR or the approach, and the published procedure is drawn beside the track that was actually flown, from the active AIRAC cycle on the day of the flight rather than today's. A deviation becomes something you can see, and the question of which approach was executed answers itself.
None of it means opening another tool, so you are not cross-referencing three sources to read one approach.
From detection to trends
Detection is fully automated. By the time you open a flight, its events have already been detected, so your time starts at the interesting part.
You look at the event in the replay, and its parameters and context. You can validate it, or set it aside as a false trigger, and the decision is recorded, with your comment. Nothing is quietly deleted, and an accepted flight can be reopened or reprocessed if needed.
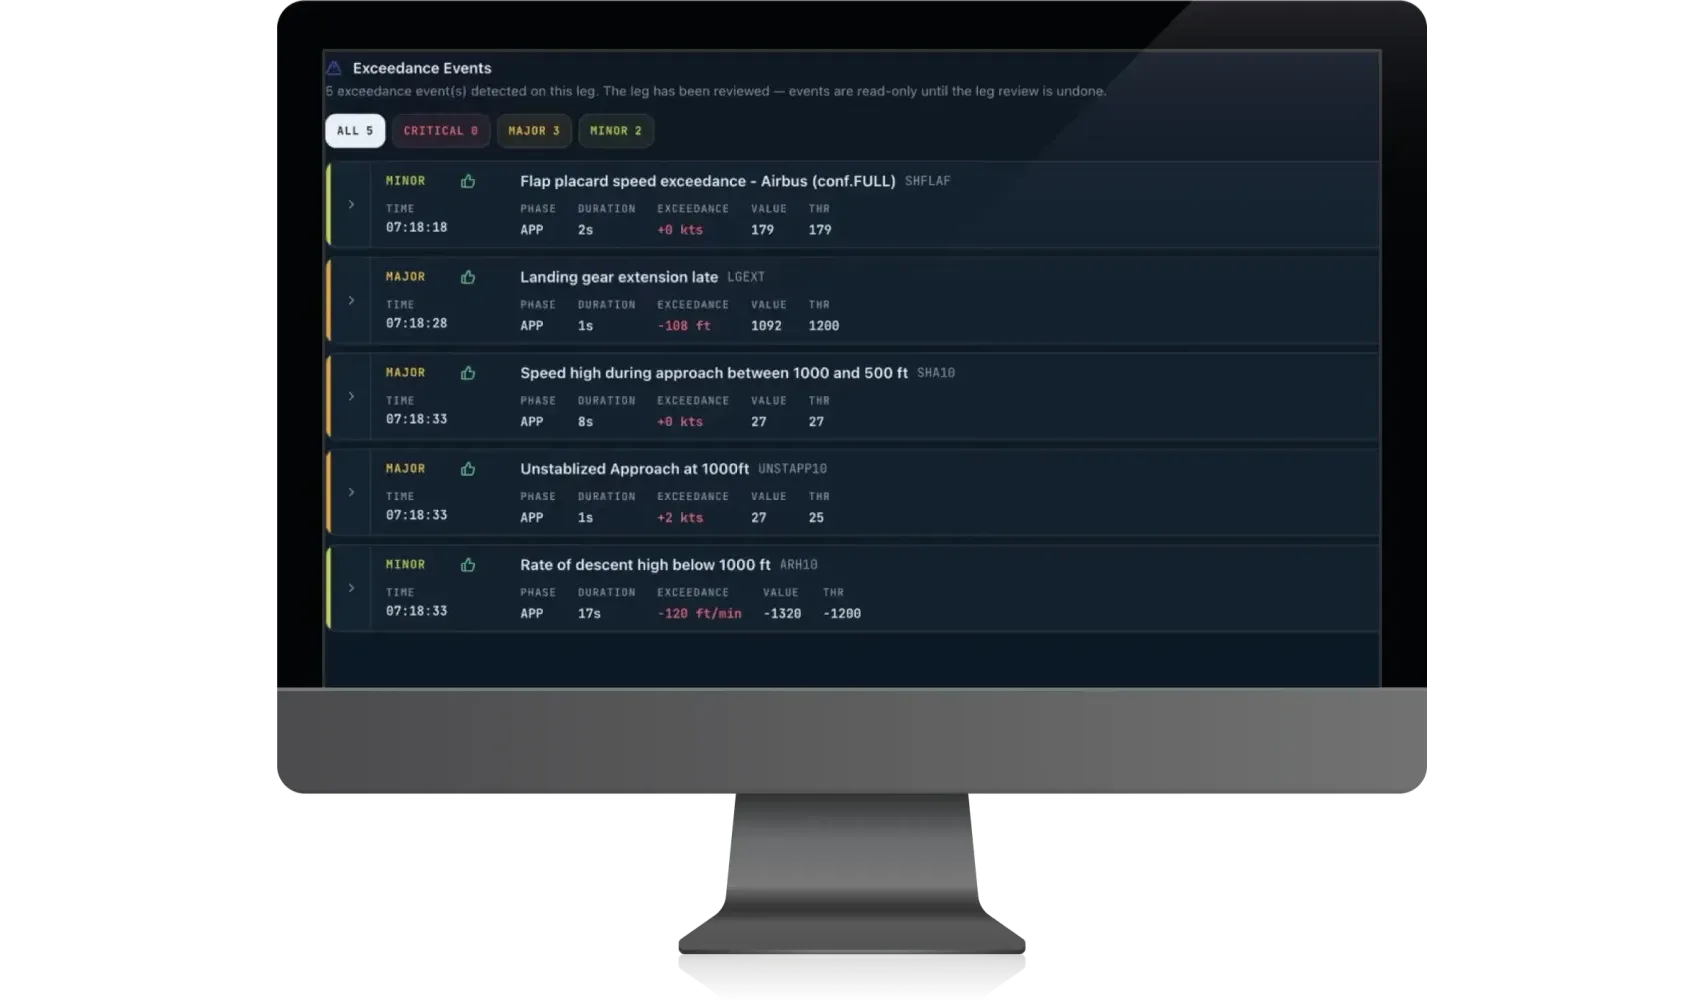
And with the Pilot Performance module, each event also counts towards the rates of the pilot flying the leg, and a pilot given access signs in to see their own performance, not a colleague's.
A validated finding carries its context with it. When the Safety Manager asks whether this was a one-off, you do not open a new spreadsheet. You ask the same question of the fleet: this event type, per hundred legs, by fleet and by period. The trend is a report you build yourself, not a ticket you raise with us, and it is one the Accountable Manager can read without an analyst standing beside it.
And when a trend tells you that the detection itself needs to change, the change to your Event Definition Sheet (EDS) can be made easily and in line with the continuous-review discipline ORO.AOC.130 AMC and FAA AC 120-82 describe. The threshold you used last quarter stays on record beside the one you use now for comparison.
That is the whole journey: from a threshold crossed on one flight to a trend line the person who owns the risk can act on. It is the same journey whether you fly one aircraft or a hundred.
What this is built on
We have been running FDM programmes for ten years, across more than 40 aircraft types, and we process 40,000 flights a month. The investigation experience in v2 is what we wanted while doing that work the long way: the flight first, the numbers when you need them, the trend when the board asks.
See it on your data
Bring one of your flights, or tell us your aircraft type and recorder and we will use ours for demonstration. Request a demo and see what an investigation looks like when the flight comes first. The video and the rest of v2 are on the AeroSight FDM v2 page.
Tomorrow's deep-dive, "Your FDM programme's health, on the dashboard", turns from the single flight to the FDM programme as a whole. And if you are at the World Aviation Festival in Lisbon on 13 to 15 October, come and see it in person.
Related Articles
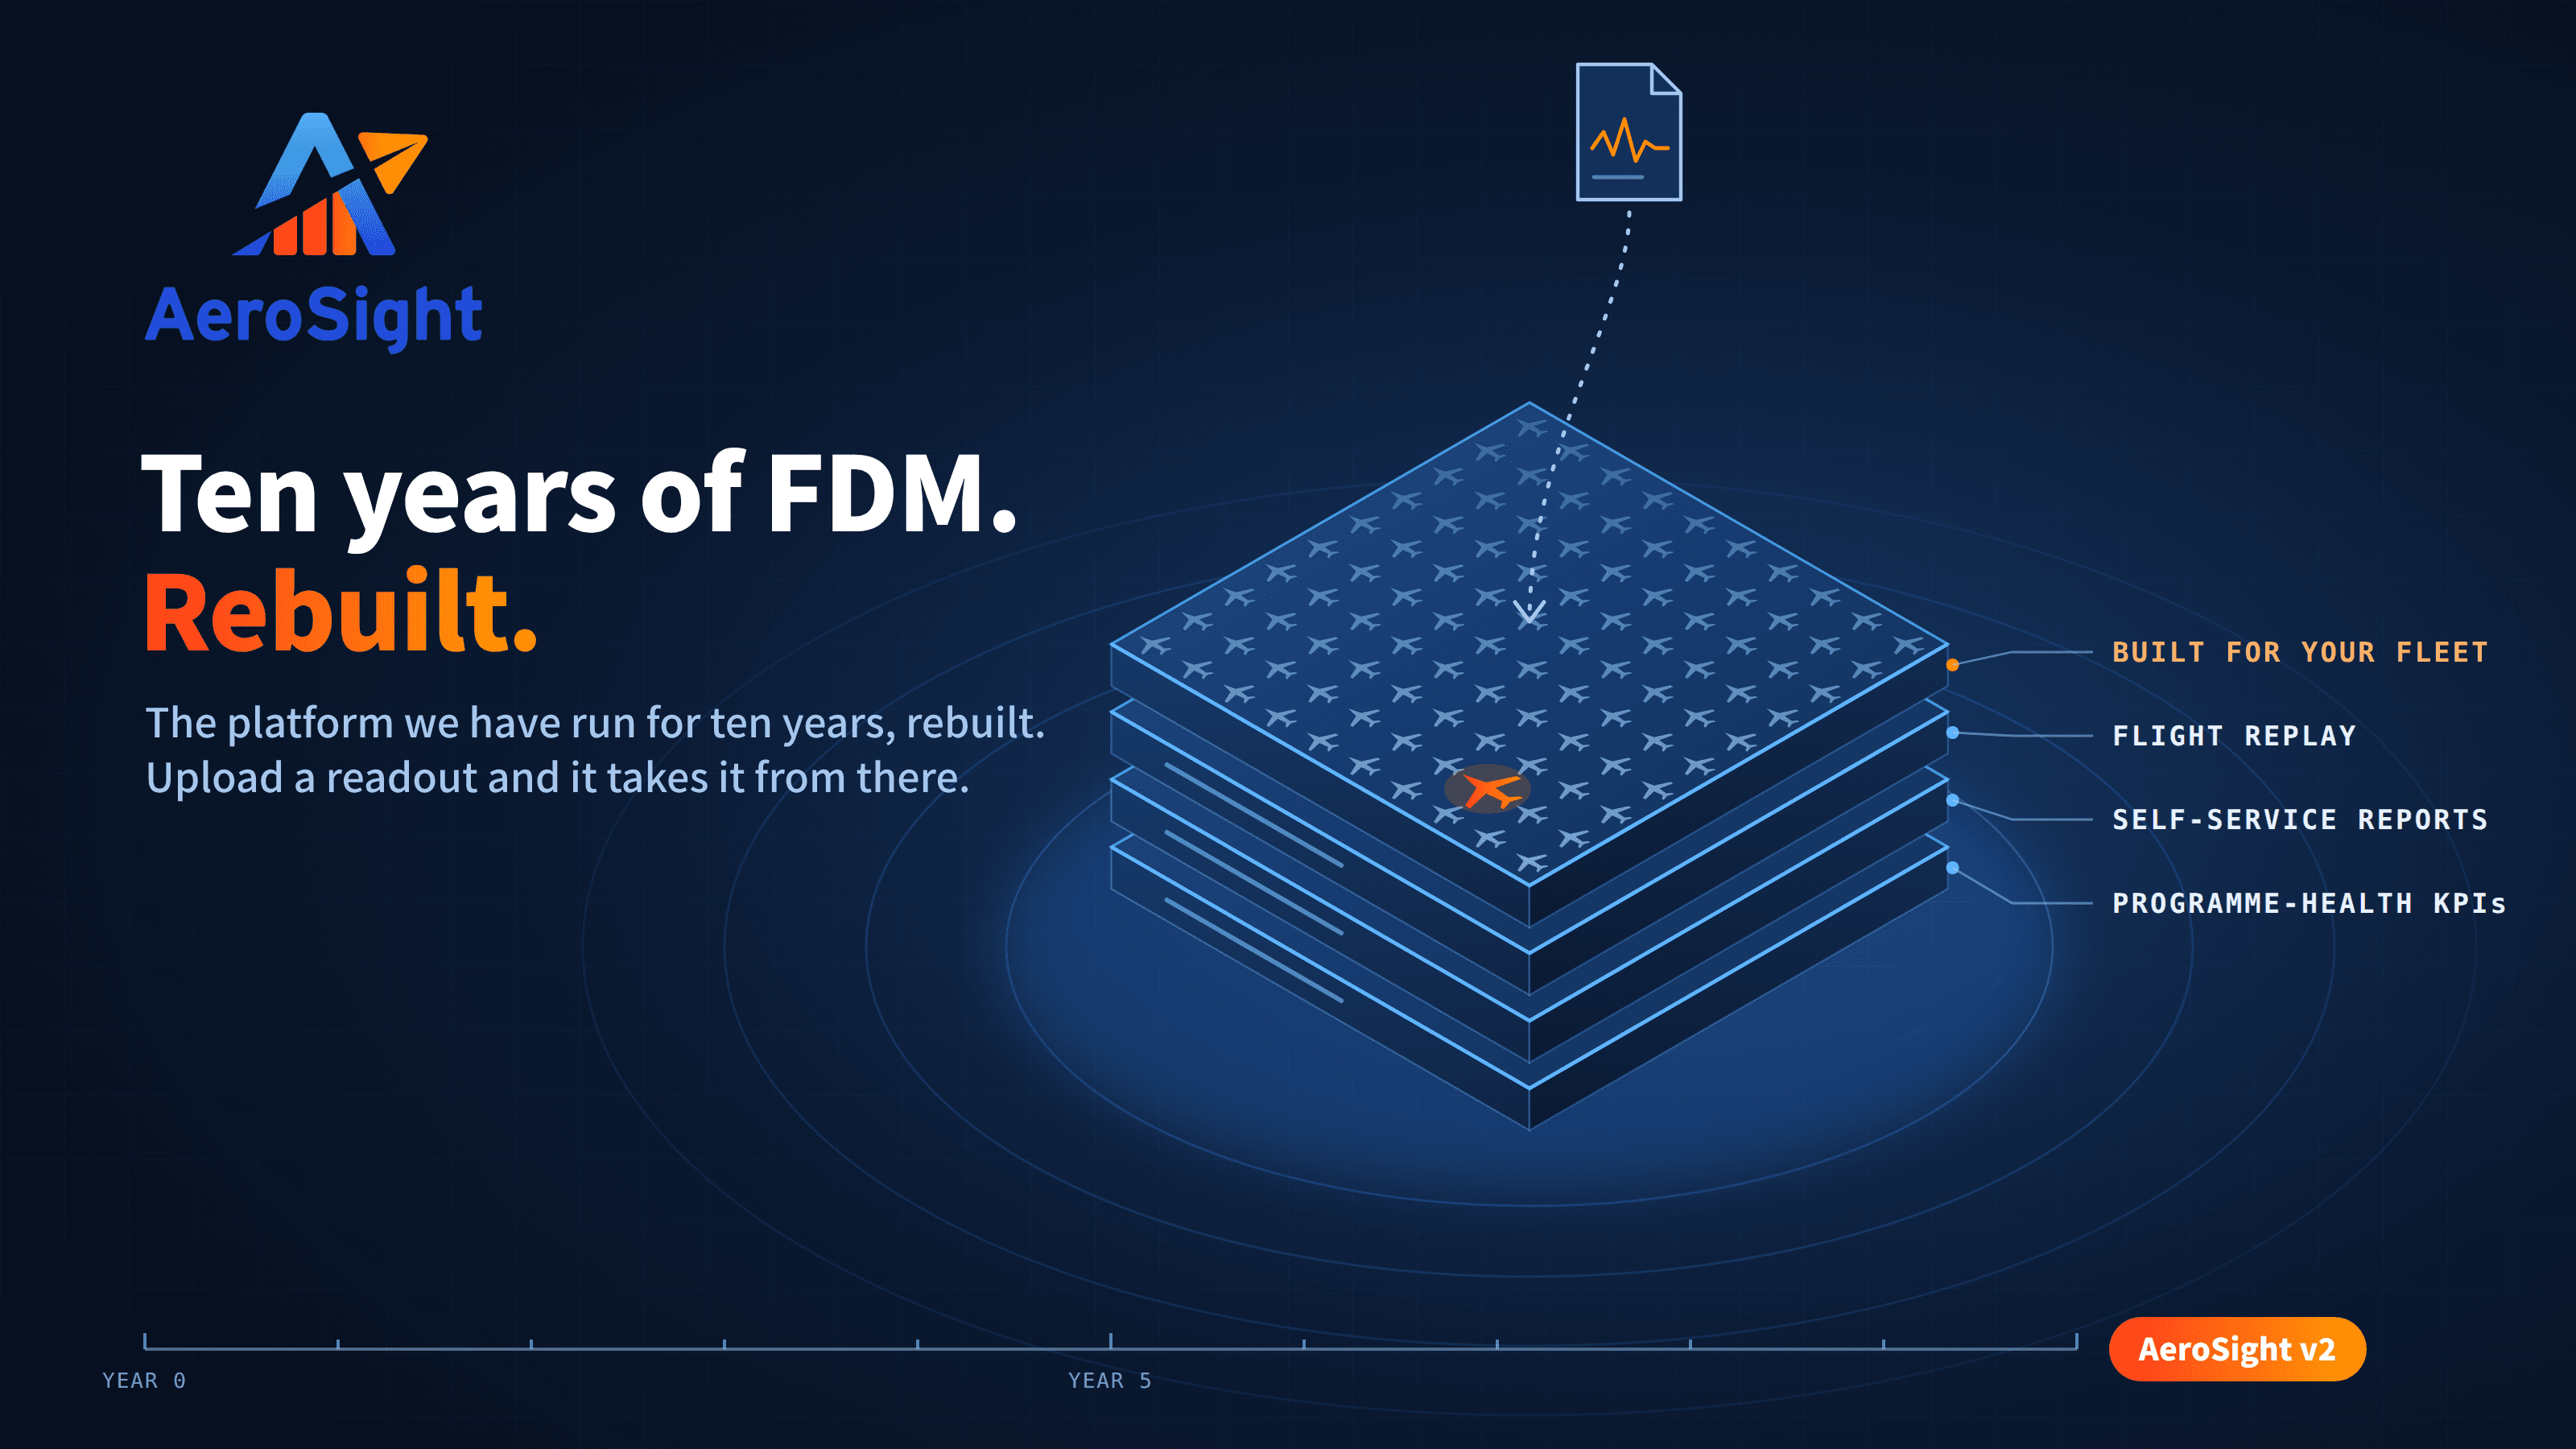
Introducing AeroSight FDM v2 - what ten years taught us
AeroSight FDM v2 is a rebuild of the platform we have run for ten years: every flight your fleet flies, event detection you tune yourself, programme-health KPIs, self-service reports, fuel efficiency and Live Fleet Monitoring, for one aircraft or a hundred.